What is a Fishbone Diagram

Fishbone diagrams (commonly known as Ishikawa diagrams, herringbone diagrams, or cause-and-effect diagrams) is a diagram used to identify the cause of an effect or a problem. Its name is derived from its fishbone shape, with the problem at the head of the diagram, and its causes along the spine of the "fish".
A fishbone diagram (template) is a diagram or visualization tool for brainstorming practice using an ideal mind map template. It is considered much valuable in product development and readjustment. And its main focus is on the feedback about the problem. At first, a group of people brainstorms about the causes behind a problem. Then, the facilitators assist the particular group in reviewing each case based on its importance and hierarchy in the diagram.
So when are fishbone diagrams most commonly used?
- Identifying the root cause of a problem
- Identifying why parts of a process aren’t working
- Conducting a mult-variable analysis of a problem
To make or edit a fishbone diagram, try EdrawMind for free!
Do you know what is a fishbone diagram? The fishbone diagram was first developed in the 1920s but was popularised in the 1960s by Japanese professor Kaoru Ishikawa (which is why the diagram is sometimes referred to as the Ishikawa diagram). A pioneer in quality management, the Ishikawa diagram is now considered a staple in analyzing most industrial processes.
Before diving deep into the topic, it’s crucial to know that what are the advantages and disadvantages you have to face while utilizing this deep analysis tool, Fishbone Diagram!
| Pros | Cons |
|
|

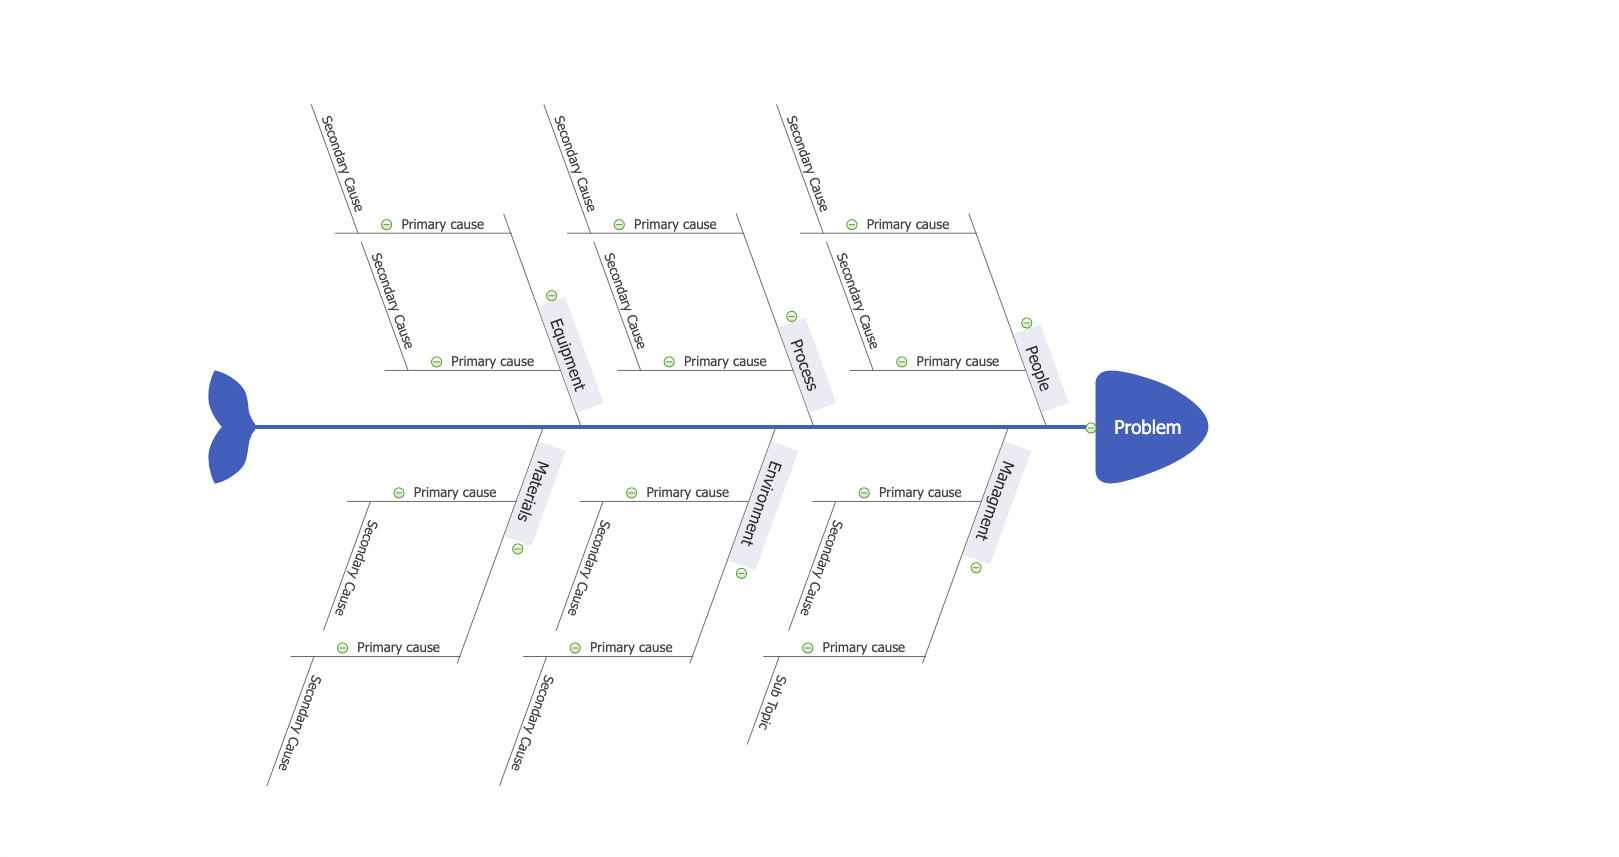
- The problem or effect is located at the ‘head’ of the diagram.
- The categories are connected to the ‘spine’ of the diagram. In the example above, they are Equipment, Process, People, Materials, Environment, and Management.
- Primary Causes are connected to the categories horizontally.
- Secondary Causes are connected to the Primary Causes. Secondary Causes lead to Primary Causes, but do not cause the problem themselves.
As mentioned, the fishbone diagram is most commonly used to identify the root cause of a problem. Each identifiable cause can be traced back to a root cause. One such method of tracing is known as the 5 Whys technique. The concept behind the technique is that if you keep questioning why a problem exists, you will eventually get to the root of the problem.
As shown in the diagram in the section above, the causes can be placed into categories. Some of these categories may include:
1. The 5 Ms (used in manufacturing)
- Man / Mind Power
- Machine / Equipment
- Material (Physical materials or information)
- Method / Process
- Measurement / Medium
- Mission / Mother Nature
- Management
- Maintenance
*The 5 Ms has been expanded to sometimes include the final three categories. This expanded list is commonly referred to as The 8 Ms.
2. The 8 Ps (used in product marketing)
- Product / Service
- Price
- Place
- Promotion
- People / Personnel
- Process
- Physical evidence
- Performance
3. The 4 Ss (used in service industries)
- Surroundings
- Suppliers
- Systems
- Skills

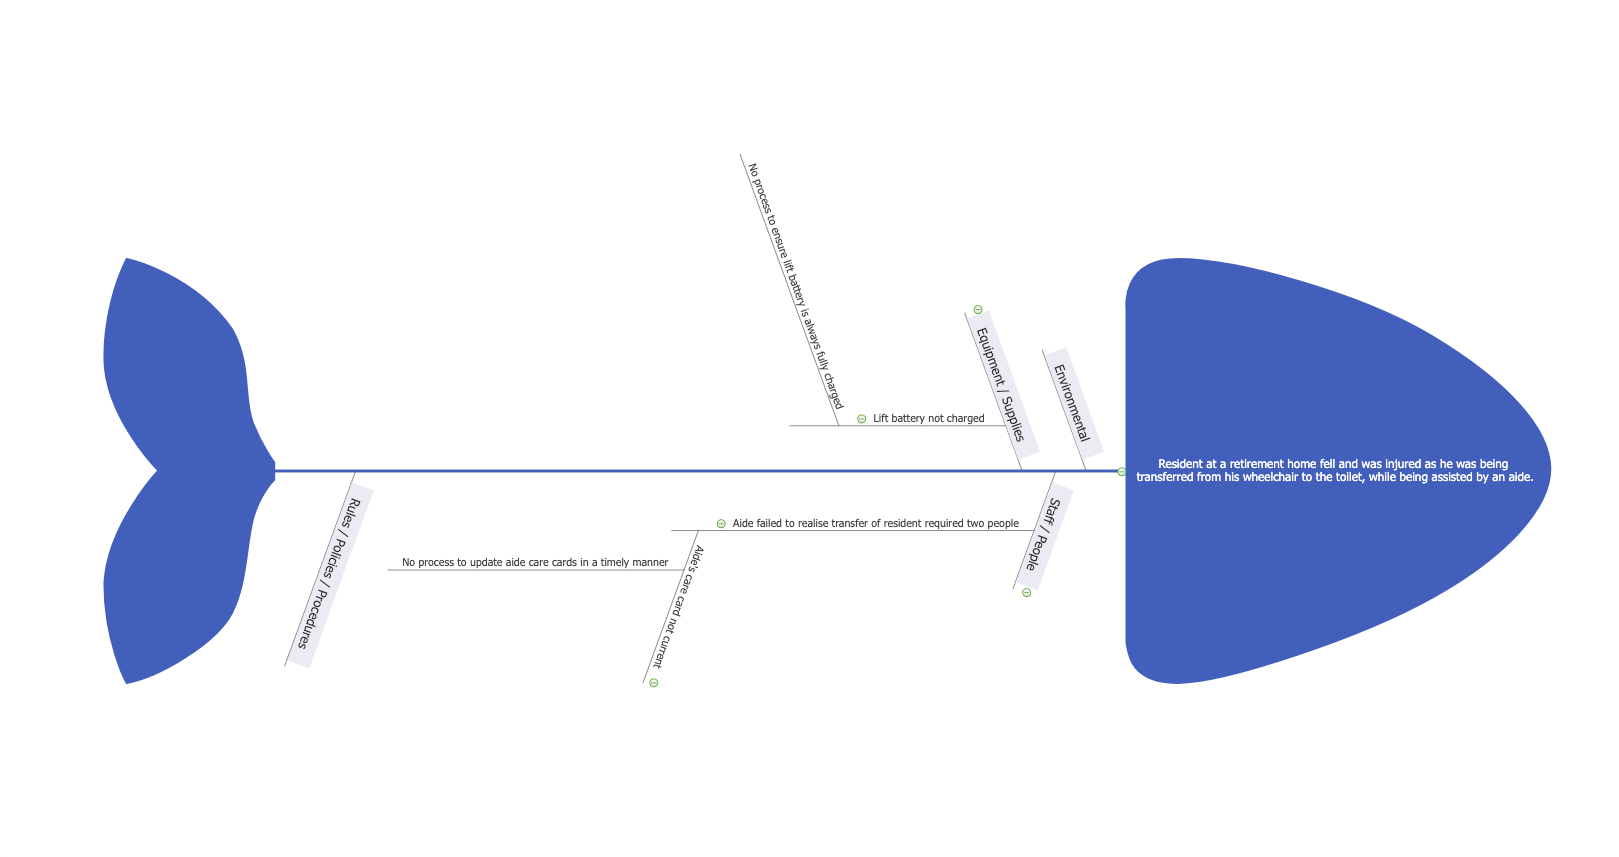
In this first example, a resident at a retirement home was injured while being transferred from his wheelchair to the toilet. This fishbone diagram details the causes of the accident, and the factors behind several of them, namely the inadequacies of the retirement home staff and equipment.

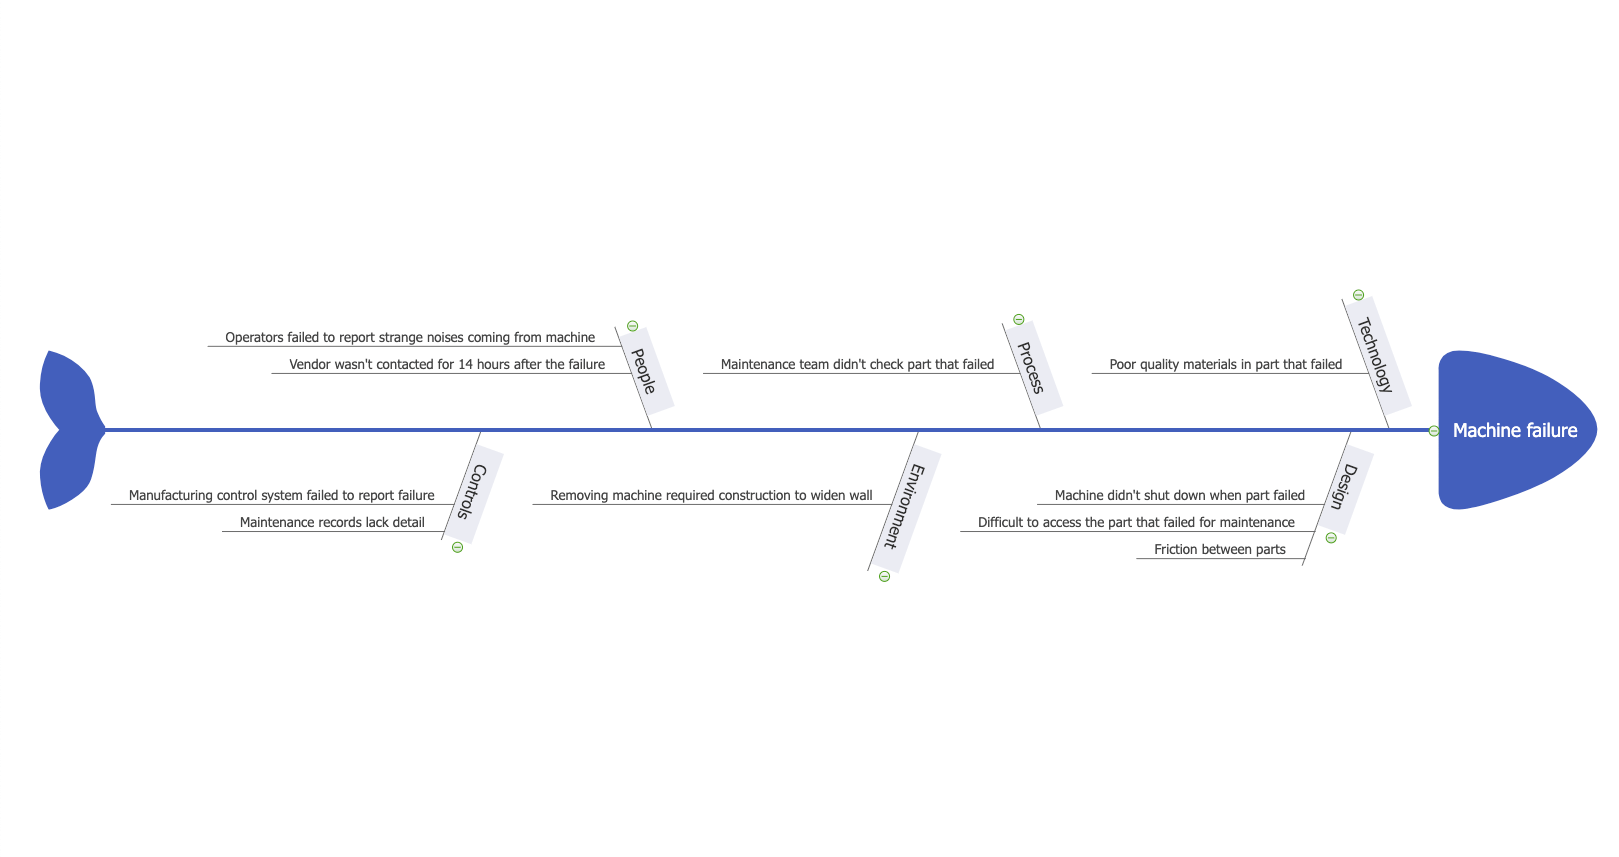
In this second example, a machine in a factory malfunctioned. This fishbone diagram details several design and systematic failures that led to the machine malfunctioning.
Believe that you have known what is a fishbone diagram. EdrawMind is a mind map tool that comes up with an intuitive interface to express your thoughts, notes, ideas, etc. This full-featured and easy-to-use program offers all the tools with which you can’t only create mind maps via templates but also the diagrams like fishbone diagrams. A fishbone diagram is a cause-and-effect diagram created to ease your problem.

Let’s know how to create a fishbone diagram with EdrawMind:
Step 1: The first step involves planning where you need to identify the problem, categorize the issues, know the causes, and then reach the root cause.
Step 2: Secondly, download and install EdrawMind. check all the diagrams available on the main interface. Click on the "Fishbone” from "New" and type the problem on the fish head.
Step 3: Now press the "Insert Topic" from the main toolbar to add the cause. Repeat the same for other causes.
Step 4: To write the sub-cause, hover the mouse on the cause branch until the plus sign appears. You are open to adding multiple sub-causes.
Step 5: After adding all the branches, your fishbone diagram has been created. Now, export it by clicking "File" > "Export" and choose the output format.


