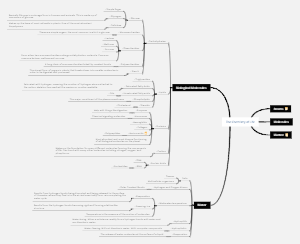
MindMap Gallery Anesthesiology knowledge map
The figure below summarizes the relevant knowledge points of anesthesiology, respiratory function monitoring and clinical application, including general monitoring of respiratory function, monitoring of ventilatory function, monitoring of oxygenation function, monitoring of small airway function, monitoring of respiratory mechanics, and ultrasound in pulmonary function Applications in monitoring.
Edited at 2021-06-25 23:19:33El cáncer de pulmón es un tumor maligno que se origina en la mucosa bronquial o las glándulas de los pulmones. Es uno de los tumores malignos con mayor morbilidad y mortalidad y mayor amenaza para la salud y la vida humana.
La diabetes es una enfermedad crónica con hiperglucemia como signo principal. Es causada principalmente por una disminución en la secreción de insulina causada por una disfunción de las células de los islotes pancreáticos, o porque el cuerpo es insensible a la acción de la insulina (es decir, resistencia a la insulina), o ambas cosas. la glucosa en la sangre es ineficaz para ser utilizada y almacenada.
El sistema digestivo es uno de los nueve sistemas principales del cuerpo humano y es el principal responsable de la ingesta, digestión, absorción y excreción de los alimentos. Consta de dos partes principales: el tracto digestivo y las glándulas digestivas.
El cáncer de pulmón es un tumor maligno que se origina en la mucosa bronquial o las glándulas de los pulmones. Es uno de los tumores malignos con mayor morbilidad y mortalidad y mayor amenaza para la salud y la vida humana.
La diabetes es una enfermedad crónica con hiperglucemia como signo principal. Es causada principalmente por una disminución en la secreción de insulina causada por una disfunción de las células de los islotes pancreáticos, o porque el cuerpo es insensible a la acción de la insulina (es decir, resistencia a la insulina), o ambas cosas. la glucosa en la sangre es ineficaz para ser utilizada y almacenada.
El sistema digestivo es uno de los nueve sistemas principales del cuerpo humano y es el principal responsable de la ingesta, digestión, absorción y excreción de los alimentos. Consta de dos partes principales: el tracto digestivo y las glándulas digestivas.
Anesthesia 8. Respiratory function monitoring and clinical application
General monitoring of respiratory function
Monitoring of respiratory movements
Frequency, amplitude, mode
10-16 times/min, >20 times/min, >30 times/min
Upper respiratory tract obstruction: three concave signs
Lower respiratory tract obstruction: prolonged expiratory phase
Chest percussion and auscultation
Dry and wet rales, wheezes, breath sound asymmetry, inflammation, pneumothorax, percussion, pneumothorax, pleural effusion
Monitoring of ventilatory function
ventilation function
Tidal volume (VT)
During calm breathing, the amount of air inhaled or exhaled each time, 5-7ml/kg
Minute ventilation (VE)
VE is the total amount of air inhaled or exhaled per minute at rest, the product of tidal volume and respiratory rate.
Alveolar ventilation (VA)
VA=(VT-Dead Space Volume)✖Respiratory Rate
Dead space volume/tidal volume (VD/VT)
When there is no gas involved in gas exchange in mechanical ventilation of 0.2-0.3 tidal volume, VD/VT >0.6 is difficult to wean off the machine.
Maximum ventilation volume (MVV)
When trying to breathe deeply and quickly, the maximum volume of air that can be inhaled or exhaled per minute reflects the individual's ventilatory reserve function.
Forced vital capacity (FVC)
The maximum amount of air that can be exhaled as soon as possible after the maximum inhalation
Forced expiratory volume (FEV)
The volume of air exhaled per unit time as a percentage of FVC
Maximum mid-expiratory flow (MMEF)
Expressed as the percentage of actual measured value to predicted value, normal is >75%, and the assessment of obstructive ventilatory dysfunction is more sensitive than FEV1% and MVV.
Carbon Dioxide Monitoring
Monitoring indicators and methods
Arterial blood carbon dioxide partial pressure (PaCO2): 35-45mmHg is the best indicator of effective alveolar ventilation.
Transcutaneous partial pressure of carbon dioxide (PtcCO2)
End-tidal carbon dioxide partial pressure (PETCO2)
PETCO2 is 3-5mmHgCO2 waveform lower than PaCO2
Height: alveolar air CO2 concentration
Baseline: Inhaled CO2 concentration
Clinical application
PaCO2 directly reflects ventilation status and determines acid-base imbalance.
PaCO2>45mmHg: increased CO2 production, insufficient alveolar ventilation, CO2 pneumoperitoneum, low tidal volume, soda lime failure, valve failure
PaCO2<35mmHg: hyperventilation, low metabolic rate, reduced CO2 production
CO2 waveform diagram
Increased amplitude: hypoventilation, repeated inhalation, sodium bicarbonate
Decreased amplitude: circuit disconnection, pulmonary embolism, catheter kinking
Monitoring of oxygenation function
It is of great significance for early correction and prevention of hypoxia
breathing process
internal breathing
Transport of O2 and CO2 in blood
external breathing
Oxygen exchange function
Introduction
Inhaled oxygen concentration (FiO2), exhaled oxygen concentration (FeO2)
Arterial partial pressure of oxygen (PaO2): the only indicator of hypoxemia. Normal value: 80-100mmHg
Mild hypoxemia: 60-79mmHg
Moderate hypoxemia: 40-59mmHg
Severe hypoxemia: <40mmHg
PaO2 varies with age. Over 60 years old, PaO2 is 1mmHg for every 1 year of age. PaO2 is 60mmHg, corresponding to SpO290%
Oxygenation index: PaO2/FiO2>300mmHg
Mild ARDS 200<PaO2/FiO2≤300 (PEEP or CPAP≥5H2O)
Moderate ARDS 100<PaO2/FiO2≤200(PEEP≥5H2O)
Severe ARDS PaO2/FiO2≤100(PEEP≥5H2O)
Arterial blood oxygen content (CaO2): 19ml/100ml, oxygen supply
Oxygen uptake rate (O2ER): the percentage of oxygen taken up by tissue cells at capillaries from arterial blood, O2ER=VO2/DO2, 22%-32%
<0.22: Oxygen uptake disorder
>0.32: Increased oxygen demand
Pulse oxygen saturation (SpO2): Transcutaneous measurement of arterial blood oxygen saturation value to evaluate oxygenation function
Pulse oximeter (SpO2)
Factors Affecting SpO2 Accuracy
Hypothermia, hypotension, vasoconstrictor drugs, weakening of fluctuations
Methylene blue, carboxyhemoglobin
Different parts, external light and shadow interference
Central venous oxygen saturation (ScvO2)
There is a good correlation between ScvO2 and SvO2. SO2 of superior vena cava blood or right atrium blood is easy to obtain blood.
Reflect tissue perfusion and oxygenation status
Can detect and treat potential tissue hypoxia early
Normal value 70%-80%
Mixed venous oxygen saturation (SvO2)
Mixed venous blood specimens obtained from the pulmonary artery with the Swan-Ganz catheter are ideal
Balance between oxygen supply and oxygen consumption Oxygen supply ↓ or oxygen consumption ↑, resulting in SvO2↓ CO↑ and O2↑ uptake from capillaries during hypoxia
Continuous monitoring, continuously reflecting changes in CO, reflecting the balance between systemic oxygen supply and oxygen consumption to determine blood transfusion indications: SvO2 <50%
Normal value 75% (65%-85%); adequate oxygen reserve SvO2>65%; limited oxygen reserve SvO2 50%-60%; insufficient oxygen reserve SvO2 35%-50%
Alveolar air-arterial blood oxygen partial pressure difference (P(A-a)O2)
Pulmonary diffusing function, intrapulmonary shunt; air inhalation, 5-10mmHg; pure oxygen inhalation, 40-50mmHg
P(A-a)O2 determines the cause of hypoxemia
P (A-a) O2 is normal: if PaCO2↑, there is insufficient ventilation; if PaCO2 remains unchanged or ↓, FiO2↓
Increased P(A-a) O2: FiO2, age, CO, ventilation/blood flow ratio imbalance, intrapulmonary shunt, gas diffusion disorder
P50: Affinity oxygen dissociation curve of PaO2, Hb and O2 when SaO2 is 50%
Rather right than left, prefer acid to alkali
Move right, dissociate and release oxygen; pH value ↓, PaCO2↑, temperature ↑, 2,3-DPG↑
Intrapulmonary shunt rate (QS/QT)
The ratio of blood flow directly into the left heart without oxygenation to CO per minute
Anatomical shunt: 3%-5%, when shunting from right to left↑
pathological shunt
Exists when >10%, pulmonary edema and poor ventilation↑
>30% require respiratory support to improve hypoxemia
Oxygen supply and oxygen consumption
Oxygen supply (DO2)
The amount of oxygen the body provides to the tissues through the circulatory system per unit time, that is, the rate at which arterial blood transports oxygen per unit time, 520-720ml/(min*m2)
Circulatory factors, respiratory factors, blood factors
Oxygen consumption (VO2)
The total amount of oxygen consumed by body tissues per unit time depends on the functional metabolic state. 110-180ml/(min m2)
Factors that increase oxygen consumption
When the temperature rises by 1°C, oxygen consumption increases by 10%-15%
Infection or SIRS
Burns, trauma or surgery
Sympathetic excitement, pain, chills (100%) or epilepsy
β2-agonists, amphetamines, tricyclic antidepressants
In a high metabolic state or ingesting a high-sugar diet, sedation, analgesia, and muscle relaxation reduce cell metabolism and oxygen consumption.
Monitoring of small airway function
Small airways refer to bronchioles with an inner diameter of less than 2 mm.
Monitoring indicators and methods
Closing volume (CV): The volume of air that continues to be exhaled when the small airways begin to close during an exhalation.
Closing capacity (CC): The volume of air retained in the lungs when small airways begin to close. It is the sum of closing volume and residual volume.
Maximum expiratory flow-volume (MEFV) curve: a curve formed by tracing changes in flow rate and volume during maximal forced expiration.
Frequency dependence of dynamic lung compliance (FDC)
The phenomenon that dynamic lung compliance decreases significantly with increasing respiratory rate is called FDC
Clinical application of small airway function monitoring
CV/VC↑: small airway obstruction or lung elastic recoil↓
The MEFV curve is mainly used to examine small airway obstruction diseases
The ratio of normal dynamic lung compliance to static lung compliance at the same tidal volume is >0.8. In small airway disease, the value decreases.
Respiratory mechanics monitoring
Monitoring indicators and methods
airway pressure
Inspiratory peak pressure: 20cmH2O
Platform pressure: 9-13cmH2O 10%
End expiratory pressure: 0
Airway resistance: 1-3cmH2O, mechanical ventilation 9cmH2O
Lung compliance (CL): the change in lung volume caused by a unit change in transpulmonary pressure
Static lung compliance (Cst): lung elasticity 50-100ml/cmH2O
Dynamic lung compliance (Cdyn): Respiratory system elasticity 40-80ml/cmH2O
Pressure-Volume Loop (P-V Loop): Pulmonary Compliance Loop
low break point
High break point
The optimal PEEP is 2-3cmH2O above the low break point
The volume corresponding to the high breakpoint is the high limit of tidal volume
Flow rate-volume ring (F-V ring): whether there is air leakage or secretion in the loop
Work of Breathing (WOB): Select breathing mode to guide offline
Application of ultrasound in pulmonary function monitoring
Ultrasound signs of normal lung tissue
Abnormal lung tissue ultrasound signs
The application value of lung ultrasound examination