What is a cellular respiration concept map?
For those into studying science, you will surely encounter the term cellular respiration. It is a process of breaking down glucose to form and create energy. Cellular respiration includes various reactions like generating electrochemical gradients, generating heat, and performing other metabolic transformations.
It can be complicated to understand the processes. That is why most use a simple diagramming tool to classify every aspect surrounding cellular respiration. A concept map will guide you in learning the corresponding chain reactions. As it involves several cell parts, you can focus on one concept around the main subject and explain the elements involved by creating nodes and arrowheads to illustrate its connections.
Benefits of using a cellular respiration concept map
When reading several paragraphs about cellular respiration is not your cup of tea, you can opt for concept maps to help understand what it is all about. Cellular respiration has two main types - aerobic and anaerobic respiration. Under those two kinds are subcategories that have distinct processes.
Considering the context, you might find it handy to have a cellular respiration concept map to explain theories and relationships among elements clearly. Since concept maps are all about visual representation, there will be a higher probability for your viewers and readers to grasp the concept quickly.
Also, as much as concept maps help learners understand particular topics, it allows teachers to assess the subject comprehension of students. The way students will build their concept maps will tell their depth of understanding of a subject.
Cellular Respiration Concept Map Templates
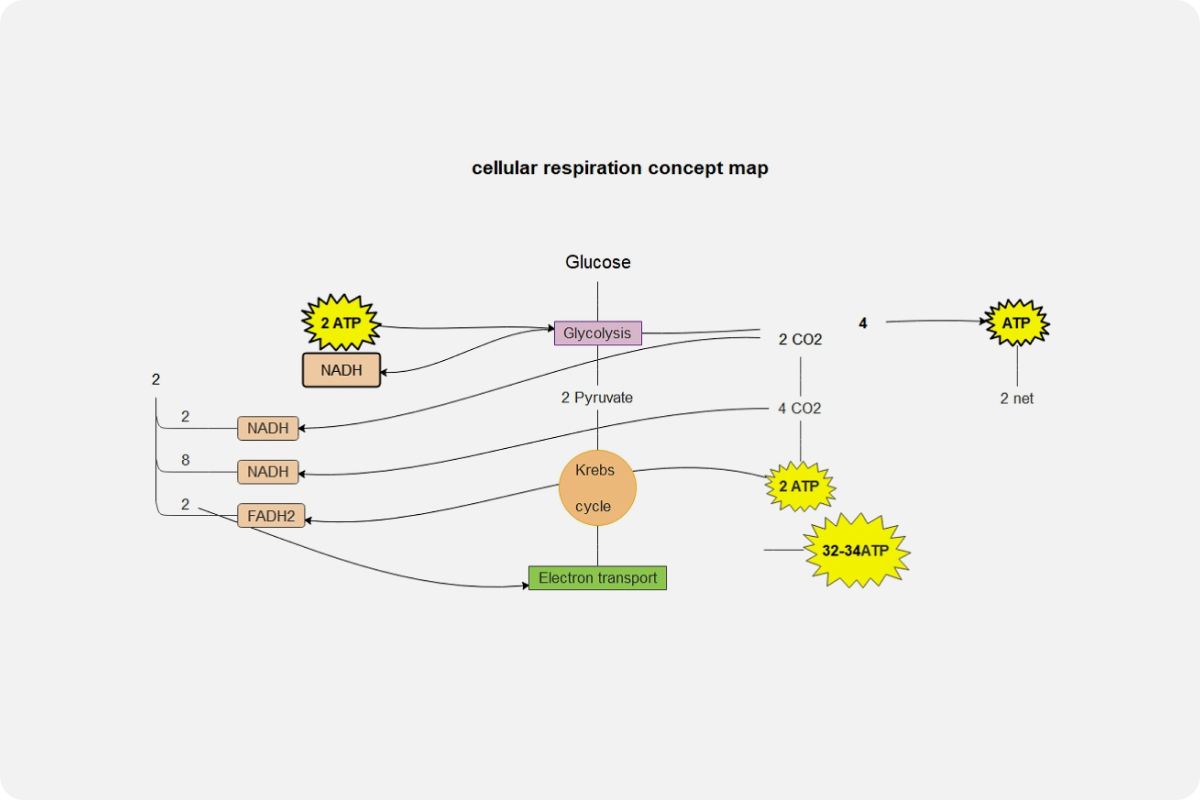
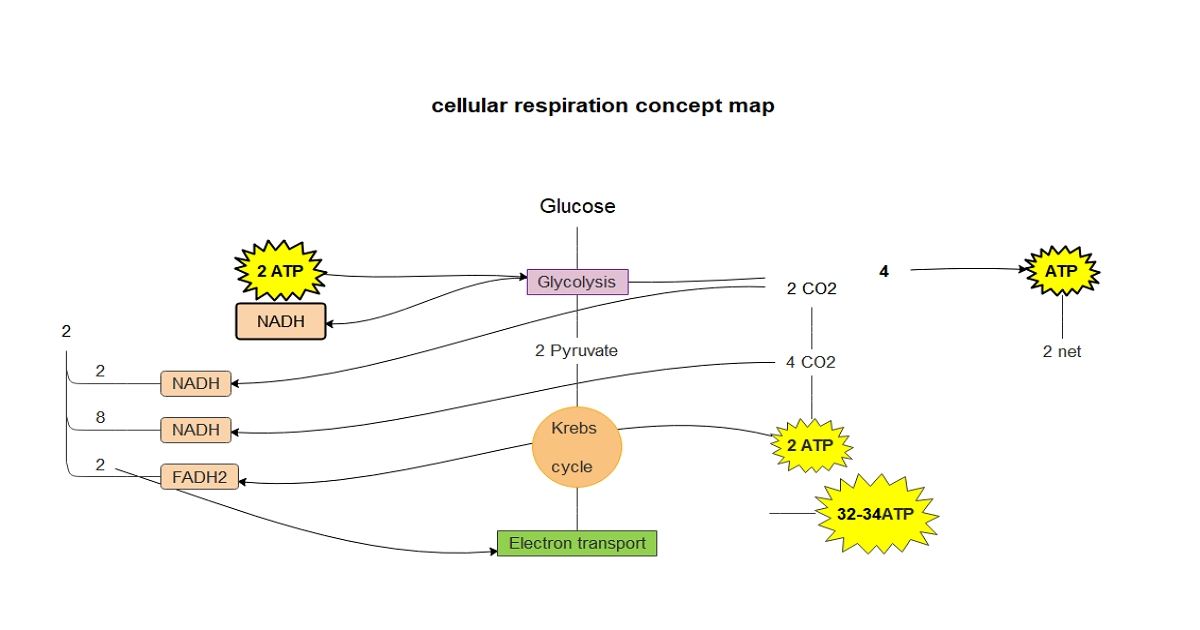
Diagramming online tools today offer a vast array of options on how to create concept maps. For your reference, below are some examples of a cellular respiration concept map. There are different stages of cellular respiration. You can classify them as glycolysis, Krebs cycle, and electron transport. The concept map below represents an overview of the three phases and is further supported with additional nodes linked using arrows. There are even labels on the side to indicate which stage they belong to.
